In our last post, we shared 10 tools that we use every day at Robot Ninja. That list was just the tip of the iceberg – we use a lot more than 10! Another set of tools that we thought deserved their own post are collectively referred to as Browser Developer Tools.
If you’re an active surfer of the web 🏄, chances are you’ve used web browsers like Chrome, Firefox or Safari. But what you may not be aware of is that each browser comes with a set a web authoring and debugging tools called “developer tools,” often referred to as “DevTools” for short.
For developers and advanced users, these tools are invaluable. They allow you to do a range of things including, but not limited, to:
- Inspecting the currently loaded HTML and CSS styles – you can view and manipulate them.
- Viewing any JavaScript errors/logs/warnings. This helps greatly with debugging.
- Analyzing network requests, allowing you to measure resource loading times.
- Viewing stored items/data, such as sessions and cookies.
We use these tools daily, so let’s go over how we use them within the Robot Ninja team, as well as how some our customers can use them in conjunction with Robot Ninja features likes our new Custom Selectors, or to simply debug and fix failing test cases.
Note: We are Mac users so this post will use browsers, shortcuts and screenshots that are Mac-centric.
How to Open Browser Developer Tools
Browser developer tools are available to anyone – you don’t need a fancy developer version of your browser, and you don’t have to download any add-ons or extensions.
Opening the browser developer tools is very similar across all the popular browsers. Depending on your browser (and version) you may, however, need to enable them before they are available to you.
Safari
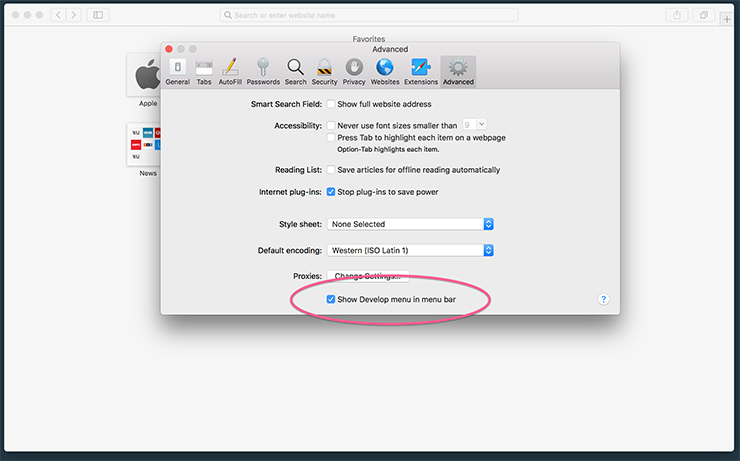
If you’re using Safari (we’ll use version 11.x ), you’ll first need to enable the “Develop” menu. To do this:
- Open Safari
- Click “Safari” (top right, next to the Apple symbol), then go into “Preferences.” You can also open Preferences by using the shortcut: ⌘, (Command + ,)
- Click the “Advanced” tab
- Select “Show Develop menu in menu bar”
Once you completed the steps above, you should have a new “Develop” menu item available to you.
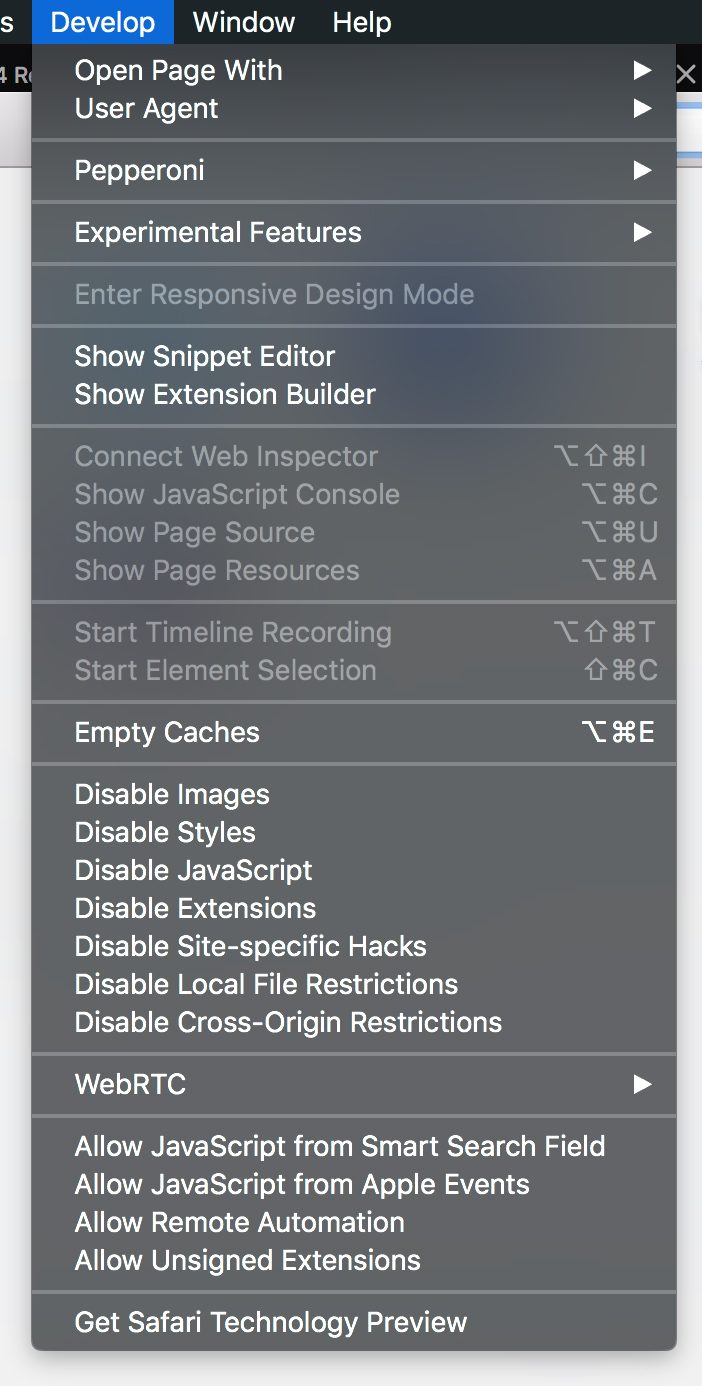
To open the browser developer tools, you’ve then got a few options:
- From the Develop menu click “Show Web Inspector”
- Use the shortcut: ⌥⌘i (Option + Command + i)
- Right click anywhere on the web page you are currently viewing and click “Inspect Element.”
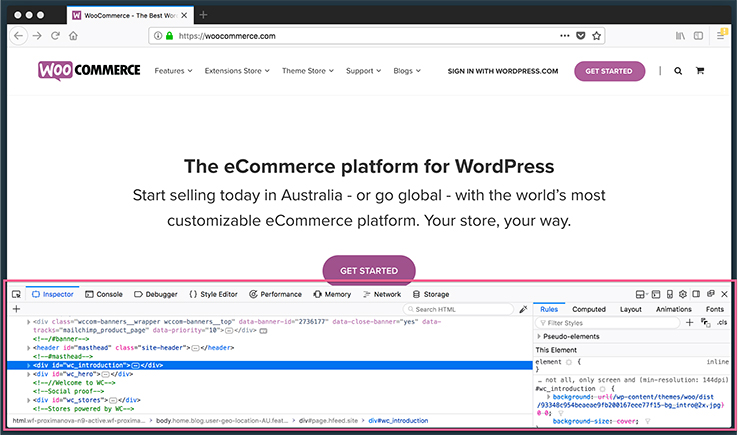
Using any of the above you should end up with something like this:
Firefox
If you are using Firefox (we’ll use Firefox Quantum version 59.x), you don’t need to enable anything.
To open the tools you have a few options:
- From the Tools menu select “Web Developer” then click on “Toggle Tools”
- Use the shortcut: ⌥⌘i (Option + Command + i)
- Right click anywhere on the web page you are currently viewing and click “Inspect Element”
Using any of the above you should end up with something like:
Chrome
If you are using Chrome (we’ll use version 65.x), you also don’t need to enable anything.
To open the tools you have a few options:
- From the View menu select “Developer” then click on “Developer Tools”
- Use the shortcut: ⌥⌘i (Option + Command + i)
- Right click anywhere on the web page you are currently viewing and click “Inspect”
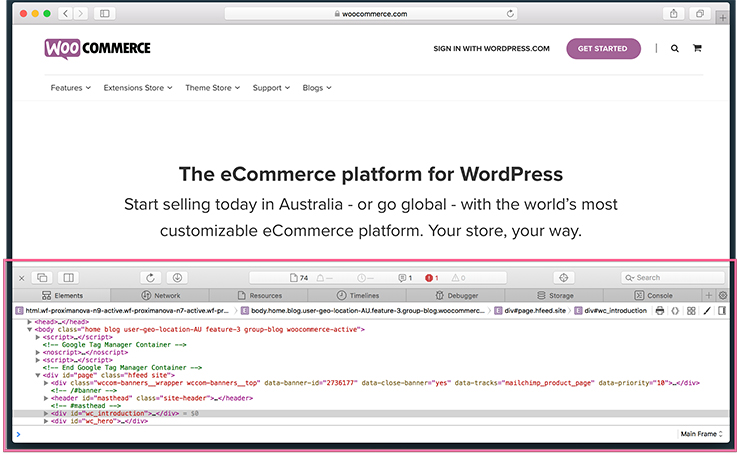
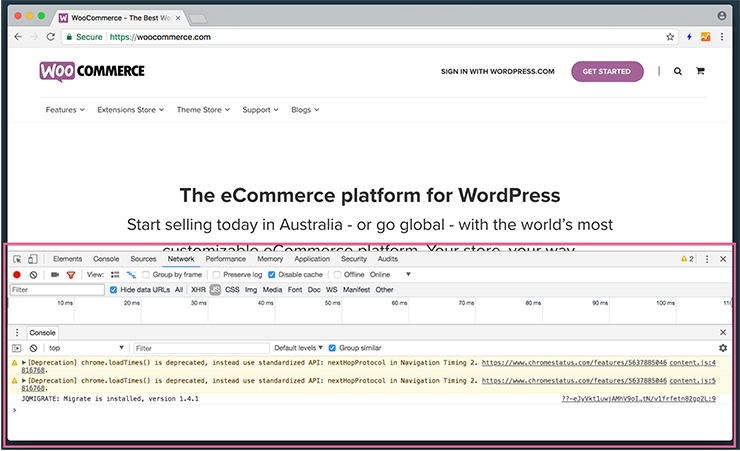
Using any of the above, you should end up with something like this:
The Available Browser Developer Tools
If you look closely at the screenshots above, you’ll see that the browser developer tools window available in each browser is slightly different. However, the tools available within each are all very similar.
You’ll typically have access to the following:
- Elements (or Inspector): Allows you to inspect and edit pages and styles
- Console: View logs and run JavaScript.
- Debugger (or Sources): Allows you to insert JavaScript breakpoints and debug JavaScript errors.
- Network: Lets you measure resource loading times.
- Storage (or Under Application in Chrome): View cookie and session data.
The Element (or Inspector) tool is typically the first tab/window you’ll see and is the main tool we’ll explore in this post.
Using the Browser Developer Tools
If you’re familiar with how the inspect element tool works, feel free to skip over this section.
The simplest way to describe the Elements/Inspector panel is that it lets you examine the HTML and CSS elements on a webpage and modify them whilst you are viewing the page. It’s a great way to:
- Test changes, and
- Debug.
Whilst browsing a web page, the simplest way to open the inspector is to right-click on any element on the page (text, button, field, image etc) and click “Inspect Element” (or simply “Inspect”). This will open the inspector panel in the browser developer tools and show you the HTML/Styles for the element you clicked on.
For example, if I’m on a Single Product page and I click the title of the product and inspect elements the inspector tools opens here:
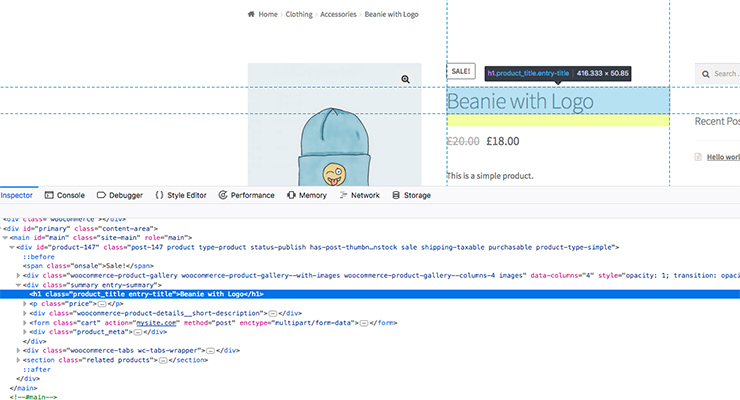
The blue line in the Inspector shows the current element being looked at and you can see:
- what HTML tag (<h1>) it’s using
- what class attributes it has and
- what the surrounding elements look like.
You can continue to examine other elements on the current page by selecting other elements in the inspector panel or using the inspector mouse tool to click on elements within the main browser window.
For more resources on how to use Browser Developer Tools, check out:
If you’re new to browser developer tools, here’s a great overview of how to use them in different browsers:
How We Use Developer Tools for Robot Ninja
Robot Ninja’s entire test suite is built on interacting with the front-end HTML elements of your WooCommerce store.
To write our tests we need to know:
- What elements on your store pages to click
- How the elements are loaded (i.e. after an event via AJAX or only when scrolled to)
- How the elements behave on the web page during interactions (i.e. are they hidden with CSS until certain criteria is reached, does the link animate in/out with clicked)
- And everything else 😅
The Inspector tool (as we’ve seen above) gives us all this information and more; it shows us exactly what HTML and CSS is being used.
Scenarios where browser developer tools are invaluable to our team include:
Writing Robot Ninja Tests
When we put together the Robot Ninja test suite, we used the Element/Inspector tool for just about every test we wrote. Even though we have access to the WooCommerce GitHub, it was often easier to use DevTools to identify the exact HTML elements and styles that we needed Robot Ninja to interact with at runtime.
When writing new tests, the first thing we did before writing any code was to step through the store, just like any customer or user would. The only difference is we did this with the Inspector tool open.
We used a few different development sites we have with different themes that we’ve derived as a baseline for Robot Ninja compatibility.
These themes are:
- Storefront
- Divi
- Flatsome
- Default WordPress theme
Using various popular WooCommerce themes as a baseline gives us a good idea of how our tests perform against different themes. It also shows up their quirks. Stepping through stores with the Inspector tool open allows us to examine what the underlying HTML looks like and how they’re being styled.
A good example of where this was particularly useful was when we wrote the checkout page tests. While it might not be obvious at first, if you have a look at the screenshot below you’ll see that the radio buttons for selecting the payment gateways are actually scaled down and positioned in the top-left corner of the payment option element.
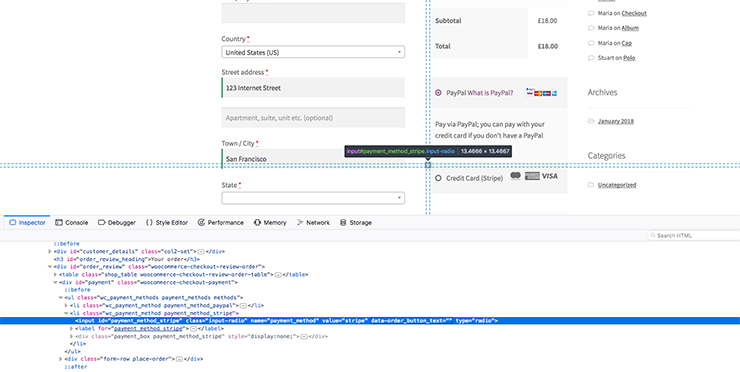
Small things like this are hugely important for us as developers to know when writing tests for Robot Ninja because if an element the test suite tries to click is hidden using CSS (e.g. display:none/opacity:0) or placed behind another element, then Robot Ninja won’t be able to find it – just like a regular user. So sometimes tests need to actually click the <li> element instead.
Debugging Issues on Customer Sites
If a customer reaches out us because they can’t quite figure out why their tests are failing, or if they can’t figure out what custom selectors to use for a custom theme, we use the inspector tool to find it.
The main benefit of browser developer tools is that we don’t need to have any special access to the stylesheets, scripts, templates or back-end server code of a customer’s site in order to see how the front-end is built. DevTools gives us quick and easy access.
We’ll explore this in more detail in the second post in this series, so stay tuned.
Adding Plugin Support
Over the course of Robot Ninja’s lifetime, we’ve adding support for seven payment gateways and 2.5 plugins (one is still in development):
- Gateways
- Stripe 4.0+, BACS, Cheque, Authorize.net, Braintree powered by Paypal, Moneris and Intuit QBMS.
- Plugins
- WooCommerce Subscriptions (our 🍞 + butter),
- WooCommerce Email Validation, and
- Checkout for WooCommerce.
When it comes to adding support for plugins, we typically like to have them installed first on a local/staging environment so that we can poke around with the different settings available and so that we can be sure we’re adding full support for that extension.
But with DevTools, having the plugin installed locally is not all that necessary.
Using WooCommerce Email Validation as an example, this plugin adds an extra required field to the checkout that Robot Ninja wouldn’t expect or know to look out for. Without needing to sift through and understand the plugin’s code, all Robot Ninja cares about is front-facing additions that affect the end user.
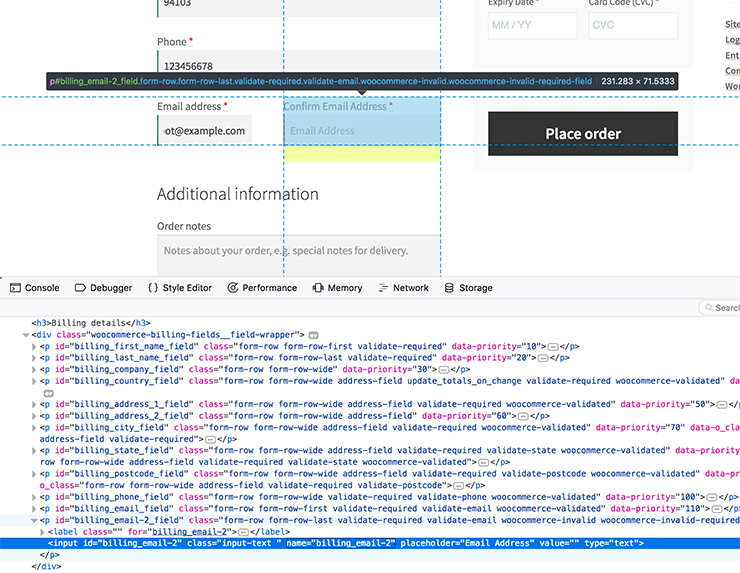
Armed with this information, we’re about to update our test suite to look for the element with ID `billing_email-2` and fill that in with the email address – then that plugin will be supported.
Writing Custom Tests
Some WooCommerce stores offer a unique experience for their customers and/or they’ve implemented a custom checkout flow that they want to test with Robot Ninja.
Robot Ninja does its best to run through tests smoothly for every WooCommerce store out there, but with WooCommerce and WordPress being open source and flexible pieces of software, Ninja bot has to adapt to the environment. And it does this through customized tests we can write for Robot Ninja customers.
So what does this process look like and what does it involve?
First we distinguish which tests need to be rewritten, tweaked or added. To help figure this out, we use the Inspector Tool – a lot!
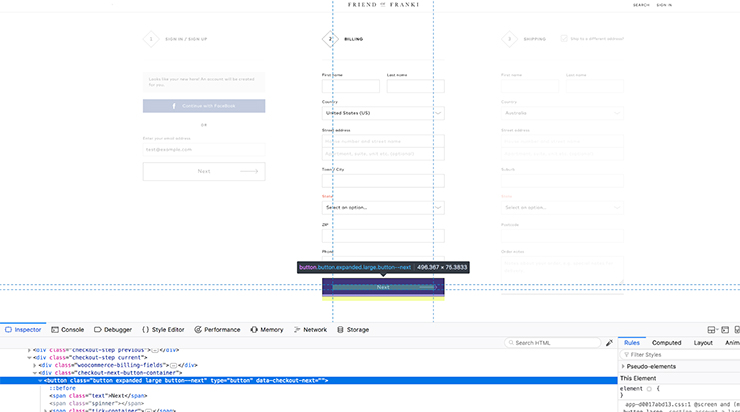
Custom tests that are rewriting existing tests are usually for immense differences between the default WooCommerce experience, like having a multi-step checkout.
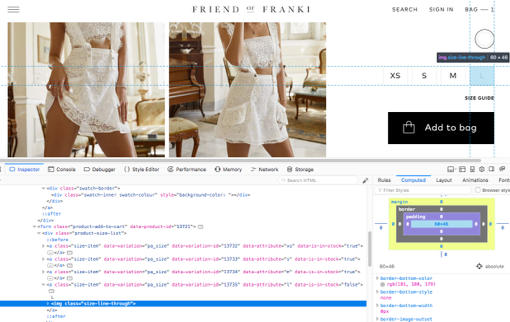
Custom tests that tweak existing tests are usually for small but unique differences to your store (or select few stores), like having out-of-stock variation options (i.e. select fields) displayed as images, or having unique fields in the checkout that are required to be filled in before processing.
Adding new custom tests for a store that features something unique in the store/user flow might involve looking for a unique string when an incorrect/invalid quantity is entered.
Each of these custom test cases involves an overall similar process in how we approach them. The first step is always opening the Inspector tool and stepping through the store’s checkout, looking for any unusual differences. Essentially, what we do is manually run through the same tests that Robot Ninja would automate, but with more of a focus on the store’s HTML and styles 🔎
Conclusion
Browser developer tools were indispensable to us when we were writing the original tests for Robot Ninja, and are still essential to our every day working helping customers diagnose issues with their tests.
With the Inspector tool in particular, we can write custom tests and help customers who aren’t sure why a particular tests isn’t working for their store. We can create custom tests for highly customized stores that feature elements Robot Ninja isn’t yet familiar with.
Hopefully this guide has given you a good overview of how we use browser development tools to enhance how we develop with Robot Ninja. This is the first post in a two-part series, so check back soon for out next post on how to debug issues with Robot Ninja tests using browser developer tools.